


Every WordPress fix guide eventually says the same thing: “check your error log.” Mine included — my articles on the 500 error and the critical error screen both send you here. But almost none of them stop to explain how: where the log lives, how to switch it on without breaking your site, and how to read the cryptic line it hands back.
This is that missing guide. Once you can read your error log, WordPress stops being a black box — instead of guessing which plugin broke the site, the log names the exact file and line. After six-plus years of debugging client sites, it’s the first place I look, every time.
Quick answer: To enable the WordPress error log, add three lines to wp-config.php — WP_DEBUG, WP_DEBUG_LOG, and WP_DEBUG_DISPLAY set to false — then reproduce the problem and open the log file at /wp-content/debug.log. Read it bottom-to-top: the newest fatal error names the exact file and line that broke your site. Turn debug off again when you’re done.
What the WordPress Error Log Actually Is
This guide is part of my complete guide to fixing common WordPress errors — the hub that maps every common error to its fix.
There are really two logs, and it helps to know which one you’re reading:
- The WordPress debug log — generated by WordPress itself when you enable
WP_DEBUG. It records PHP errors, warnings, and notices from WordPress core, plugins, and your theme, and writes them towp-content/debug.log. This is the one you control, and the one this guide is about. - The server error log — generated by your web server (Apache or Nginx), often named
error_logand found in your hosting panel or the site’s root folder. Useful when the site is so broken that WordPress can’t even start logging.
Ninety percent of the time, the WordPress debug log is the one that solves your problem — because it speaks in WordPress terms, naming the plugin file and line rather than a raw server path. Let’s turn it on.
How to Enable the WordPress Debug Log
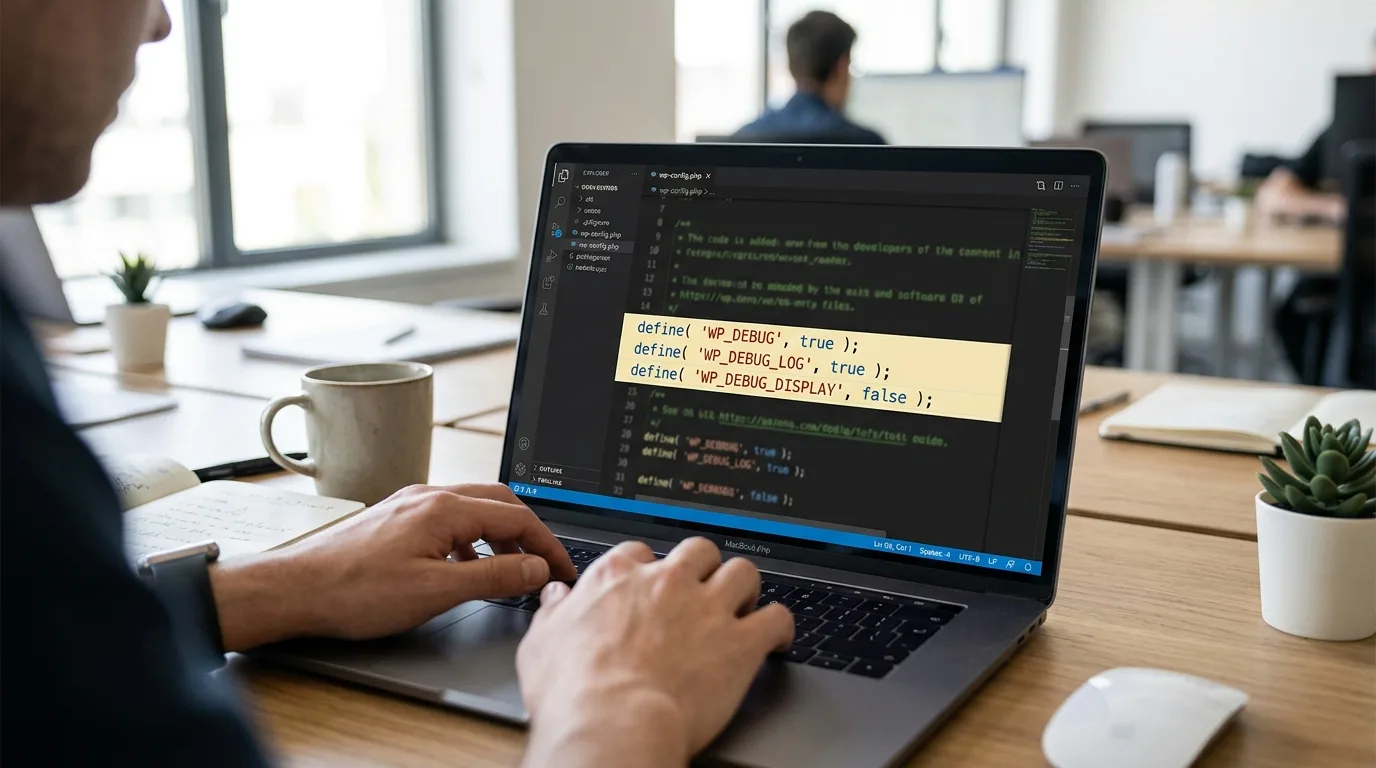
Connect to your site over FTP or your host’s File Manager, open wp-config.php in the site root, and find the line that says /* That's all, stop editing! */. Just above it, add these three lines:
define( 'WP_DEBUG', true );
define( 'WP_DEBUG_LOG', true );
define( 'WP_DEBUG_DISPLAY', false );
Here’s what each one does, because the third is the one people get wrong:
WP_DEBUG— the master switch. Turns on WordPress’s debug mode so errors are captured at all.WP_DEBUG_LOG— sends everything to thewp-content/debug.logfile instead of vanishing.WP_DEBUG_DISPLAYset to false — keeps the errors off the visible page. On a live site this matters: without it, your visitors (and any attacker) see raw error messages that expose file paths and plugin details. Log it, don’t display it.
Save the file. The official WordPress debugging handbook documents every one of these constants if you want the full reference.
One last step after any debug-and-fix session: clear your WordPress cache so visitors stop seeing cached copies of the broken state.
Where to Find the Log File
Once debug logging is on, reload your site (or repeat the action that caused the problem) so WordPress has something to record. Then navigate to:
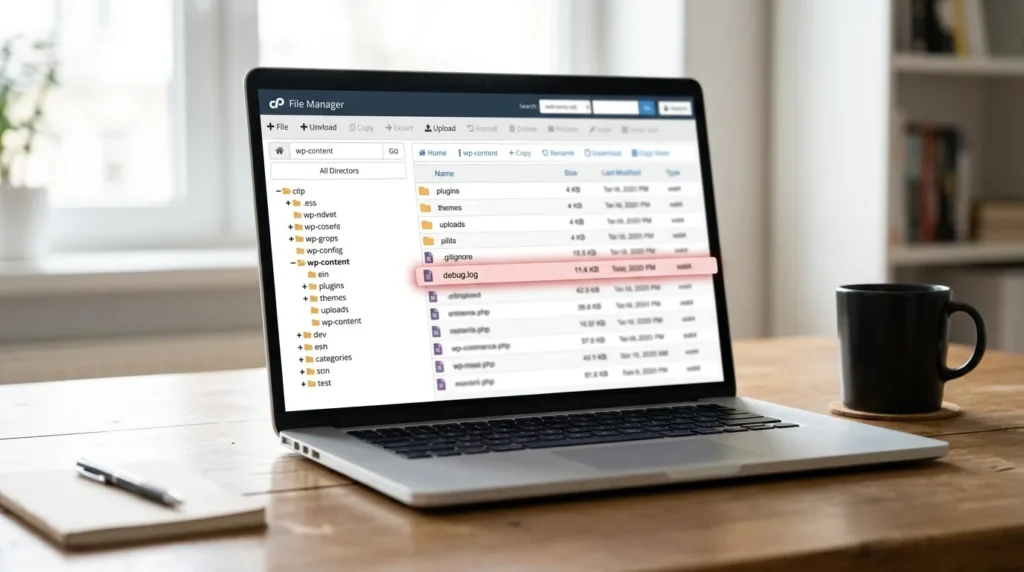
/wp-content/debug.logOpen it in the File Manager or download it over FTP. If the file isn’t there, nothing has been logged yet — trigger the error once more and refresh. One caution: on a busy site this file grows fast, so don’t leave logging on for weeks, and delete the file when you’re finished so it doesn’t balloon.
How to Actually Read the Log
A debug log looks intimidating, but every line follows the same shape: a timestamp, a severity level, a message, and — the gold — a file path and line number. Read from the bottom up; the newest entries are last, and the newest fatal error is usually your culprit. Here’s a real-world example:
[15-Aug-2026 09:14:22 UTC] PHP Fatal error: Uncaught Error:
Call to undefined function acme_helper() in
/home/site/public_html/wp-content/plugins/acme-slider/init.php:88
That single line tells you almost everything: a Fatal error (severe enough to white-screen the site), in the acme-slider plugin, in init.php, on line 88. You haven’t fixed anything yet — but you’ve gone from “the site is down” to “this exact plugin file is the problem,” which is ninety percent of the battle.
Learn to recognize the three severity levels:
- Fatal error — stops the site (or a page) dead. This is what causes white screens and 500s. Start here.
- Warning — something’s wrong but PHP limped on. Worth investigating, rarely the emergency.
- Notice — minor housekeeping complaints. Usually safe to ignore while hunting a real failure.
A noisy log full of warnings and notices is normal and mostly harmless. When you’re chasing a downed site, scan straight for Fatal error and ignore the rest.
Turning a Log Line Into a Fix
Once the log has named a culprit, the fix usually follows a familiar path. If a plugin file is named, deactivate that plugin — over FTP if you’re locked out of wp-admin, by renaming its folder in wp-content/plugins. If a theme file is named, switch to a default theme. The fatal errors that surface here are the same ones behind the HTTP 500 error and the critical error screen — so once the log points the finger, those guides walk through the rest of the repair.
And if the log points at a database problem — connection failures, missing tables — that’s a different family with its own fixes in my database connection error guide.
Can’t Edit wp-config.php? Use a Plugin
If you can still reach wp-admin but can’t (or would rather not) touch wp-config.php, the free WP Debugging plugin flips these same constants on for you, and Debug Log Manager shows the log inside your dashboard with a readable interface. They’re doing exactly what the manual method does — handy when you don’t have FTP access, though the wp-config method is always available even when the site won’t load.
Don’t Forget to Turn It Off
When you’ve found your answer, undo the change — either delete the three lines or set WP_DEBUG back to false. Leaving debug logging on indefinitely fills your disk with an ever-growing debug.log, and any misconfiguration that flips display back on could leak error details to visitors. Debug mode is a diagnostic tool you switch on, use, and switch off — not a permanent setting. Delete the debug.log file itself once you’re done, too.
Frequently Asked Questions
Where is the WordPress error log located?
The WordPress debug log lives at wp-content/debug.log once you enable WP_DEBUG_LOG in wp-config.php. Separately, your web server keeps its own log — usually named error_log — in your hosting control panel or the site’s root folder. For plugin and theme problems, the wp-content/debug.log is the one you want.
How do I enable the debug log in WordPress?
Add three lines to wp-config.php just above the ‘stop editing’ comment: define WP_DEBUG as true, WP_DEBUG_LOG as true, and WP_DEBUG_DISPLAY as false. That captures errors to wp-content/debug.log without showing them to visitors. Reproduce the problem, then open the log file to read what happened.
Is it safe to enable WP_DEBUG on a live site?
Yes, as long as WP_DEBUG_DISPLAY is set to false so errors are logged to a file rather than shown on the page. Displaying errors publicly can expose file paths and plugin details to visitors and attackers. Log quietly, read the file, and turn debug off again once you’re done.
Why is there no debug.log file in wp-content?
Three common reasons: WP_DEBUG_LOG isn’t actually enabled, nothing has triggered an error since you enabled it, or file permissions prevent WordPress from writing to wp-content. Confirm the three constants are set, reload the page that misbehaves, and check that wp-content is writable.
How do I read a WordPress error log entry?
Each entry has a timestamp, a severity level, a message, and a file path with a line number. Read the log bottom-to-top and look for the newest ‘Fatal error’ — it names the exact file and line that broke your site. Warnings and notices below it are usually noise when you’re chasing a crash.
Wrapping Up
The error log is the difference between guessing and knowing. Enable the three debug constants, reproduce the problem, read the newest fatal error bottom-up, and you’ll have the exact file and line in front of you — then turn debug back off. Every serious WordPress fix starts here, which is why it’s the first thing I reach for.
And if the log hands you a line you can’t decode — or you’d rather someone just fix the underlying problem — that’s my day job. Get in touch and I’ll take a look.
Shahbaz Ali is a senior WordPress developer with 6+ years of agency experience, specializing in WordPress development, speed optimization, and emergency fixes.